
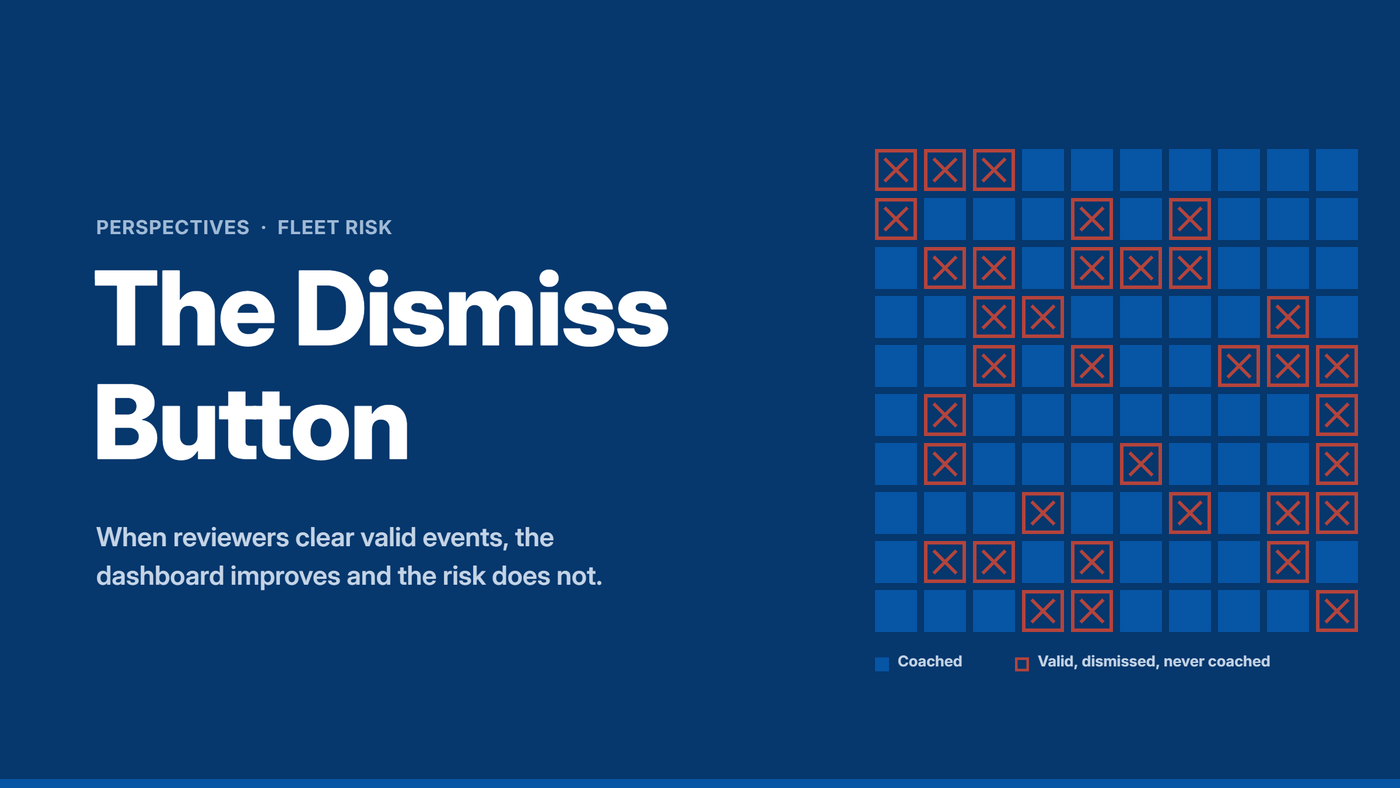
When reviewers clear valid safety events, the dashboard improves and the risk does not. Every tech-enabled risk workflow needs a human in the loop, a check on that human, and claims experience as the final test.
- In one fleet engagement, more than 70% of dismissed safety events were valid and coachable. None were coached, and the reported scores improved.
- Telematics platforms typically remove dismissed events from safety scores, so one click improves the score and the coaching rate without a conversation.
- Human review is essential, but reviewers are prone to alert fatigue and conflicts of interest. Their decisions need measuring as closely as the driver's.
- When operational data and attritional claims disagree over a credible period, the operational data is usually where the problem sits.
A safety dashboard is only as honest as the person allowed to clear it. In a recent fleet engagement, a review of a client's video telematics account found that more than 70% of the safety events marked as dismissed were valid, coachable behaviours. The drivers involved were never coached. The events dropped out of the scores leadership received each month, and the programme was reported upward as a success.
Nothing in the technology failed. The cameras detected what they were built to detect. The failure sat in the review step that every connected risk programme depends on, and in a reporting chain that had no way of seeing it. The lesson applies well beyond fleet: wherever a system flags risk and a person decides what happens next, that decision needs to be designed, measured and checked against an independent record.
One click, two better numbers
On the leading fleet platforms, dismissing an event is not a neutral filing action. Telematics vendors typically exclude a dismissed event from coaching reports and remove it from the safety score calculation, so it drops out of the coaching queue and the metrics built on it.
The design intent is sound. Event detection produces false positives, and no driver should be scored on a pothole read as harsh braking. The consequence is discussed less often. Each dismissal improves the driver's score and the coaching completion rate at the same moment, with no conversation required. A reviewer clearing a backlog, or a site manager whose league-table position rests on the score, has every incentive to press it.
The arithmetic shows how quickly the picture distorts. Take an illustrative month of 1,000 events in which half are dismissed. If 70% of those dismissals are wrong, 350 coachable events vanish from the record.
Exhibit 1. What leadership sees and what is on the road
Illustrative month: 1,000 events detected, 500 dismissed, 70% of dismissals wrong
Reported coaching completion is close to 100%. Actual coverage of coachable behaviour is under 60%.
Leadership sees 500 events, near-complete coaching and an improving score. The true position is 850 coachable events, of which fewer than 60% were addressed. The dashboard has improved; the road risk has not.
The human is the control, and the weak point
Detection on its own changes very little. Risk falls when a detected behaviour becomes an intervention, and in fleet that intervention is coaching by a person the driver knows. A Virginia Tech Transportation Institute study of seven fleets, 354 drivers and 3.8 million miles found coaching delivered within a week of the event was more effective, while sporadic coaching did less to reduce critical events.
Human judgement also supplies what the model cannot. A harsh brake may be the right response to a vehicle cutting in. A following-distance alert on a slip road may mean nothing. A person who knows the route, the site and the driver can tell the difference, and a person carries the duty of care. Regulators are moving the same way: the EU AI Act requires effective human oversight of high-risk AI systems, and the wider literature shows that oversight is not reliable by default.
The human must stay in the loop, and the human's decisions must be measured as rigorously as the driver's.
That is the difficulty. The same human factors research that justifies the reviewer describes how reviewers fail. Automation bias leads people to accept what the system suggests; alert fatigue leads them to clear what it flags. Clinical decision support is the best-documented case, where override rates are high enough for alert fatigue to be treated as a patient-safety problem. A fleet safety inbox with hundreds of events a week is built on the same pattern.
Vendor-side or client-side review
Neither model is safe on its own; the strongest design splits the work between them. Most platforms offer both routes: a managed review service run by the vendor or a specialist, or in-house review by the operator's own safety team and line managers.
Exhibit 2. Where each review model is strong, and how it fails
| Vendor-side review (managed service) | Client-side review (in-house) | |
|---|---|---|
| Main strength | Consistent calibration across many fleets; capacity to handle volume; no stake in a site's score | Knows the routes, sites and drivers; owns the coaching relationship and the duty of care |
| Main weakness | Lacks local context; decisions can become a black box; the vendor's renewal is easier when results look good | Managers are often measured on the score they are clearing; capacity is thin; reviewers drift apart |
| Typical failure | Filters aggressively to reduce complaints about noise | Dismisses to clear the queue or protect a league-table position |
| Best suited to | First-pass classification of high-volume events | Coaching delivery and context-dependent calls |
The client-side conflict is the more serious, because it is structural. Where a site manager's appraisal or bonus references the safety score, that manager should not be the only person deciding which events count towards it. The vendor-side risk is subtler: a managed service sets the threshold for what reaches the client, and few clients audit what it filters out.
The insurance consequence makes this more than an operational question. Underwriters increasingly ask for telematics scores at renewal. Scores that have been cleaned by unchecked dismissals raise a fair presentation question under the Insurance Act 2015, and undermine the evidence a fleet hopes to be rewarded for.
The recommended design separates duties. Classification sits with someone who has no stake in the score, whether a managed service or a central safety function. Coaching sits with line managers. Dismissal of high-severity event types requires a second sign-off. An independent party samples the dismissals. The test of the model is whether anyone checks who pressed the button and why.
Claims are the harder record
When operational data and attritional claims disagree, the operational data is usually the place to look first. The public evidence supports this, though it stops short of showing that claims data is always right.
Is operational data usually the weaker record?
Broadly supported, with conditionsThe Health and Safety Executive estimates that employers report only around half of the non-fatal injuries they are legally required to report under RIDDOR, which is why it treats the Labour Force Survey as its preferred measure.
On the roads, the Department for Transport has long acknowledged that hospital, survey and compensation claims data all show more casualties than police records. A DfT linkage feasibility study matched only around 70% of in-scope ambulance casualties to police data.
The common thread is discretion. A record that depends on someone choosing to report, classify or keep an event will undercount, and it will undercount most where the person recording has a stake in the result. A managed telematics workflow passes through several such choices: configuration, review, classification and reporting. An attritional claim involves a third party with a financial reason to report it, whether a claimant, another driver or a repairer. It is much harder to dismiss.
The principle has limits that any serious comparison must respect.
- Excess and self-insured layers. Losses below the excess never become claims, and reporting incentives such as deductibles are known to suppress claim counts. Fleets with large deductibles need their own incident and repair records reconciled as well.
- Development lag. Recent periods are understated until late-reported claims arrive. Compare matured periods, or allow for incurred but not reported claims.
- Credibility. A small fleet or a single year produces noise. Large losses are volatile, which is why attritional frequency is the right comparator.
- Exposure and mix. Fleet growth, new routes or vehicle changes move claims without any change in behaviour. Normalise per vehicle or per million miles.
- Fault and fraud. Non-fault and induced claims reflect other people's behaviour, so analysis should separate fault from non-fault.
The defensible statement is therefore a narrow one. Over a credible, matured period, attritional claims frequency is harder to edit than operational data. A persistent divergence between the two should be investigated in the operational data first.
A QA standard for system reporting
A reporting line that cannot show its own error rate should not be trusted by a board or an underwriter. The controls below are the minimum for any tech-enabled risk workflow where people adjudicate system flags.
- Report raw and adjudicated figures togetherLeadership sees events detected, dismissed and coached, with the dismissal rate beside them. Adjudicated figures never travel alone.
- Treat the dismissal rate as a key risk indicatorCut it by reviewer, site, event type and reason code, and investigate outliers against the platform's known false-positive rate for that event type.
- Make reasons mandatoryCap the use of "other", and require a second sign-off to dismiss high-severity types such as handheld phone use or distraction.
- Re-review a blind sample every monthSomeone outside the line re-classifies a random sample of dismissed events, for example 5% or at least 30 per site. The agreement rate is published with the safety figures.
- Measure time to coachCoaching delayed by weeks is weaker coaching, so the interval belongs in the report.
- Put configuration under change controlA change to sensitivity thresholds, event types or driver assignment can move counts more than any change in behaviour. Log each change and annotate the dashboard.
- Reconcile to claims every quarterCompare attritional claims frequency per million miles with raw and adjudicated event rates, and trace each claim back to the driver's prior events, including any that were dismissed.
- Separate dutiesNobody whose rating or reward depends on the safety score is the sole reviewer of its inputs.
The quarterly reconciliation is where the controls pay for themselves. Read together, the three measures show which part of the system is moving.
Exhibit 3. Reading the quarterly reconciliation
Direction of each measure over the same matured period
| Raw events | Adjudicated events | Attritional claims | Likely reading |
|---|---|---|---|
| ↓ Falling | ↓ Falling | ↓ Falling | Working Behaviour is improving; keep testing persistence |
| → Flat | ↓ Falling | → Flat | Review layer The improvement is coming from review; audit dismissals |
| ↓ Falling | ↓ Falling | → Flat or ↑ | Check set-up Check the configuration log and exposure before claiming success |
| ↑ Rising | → Flat | ↑ Rising | Audit now Events are being absorbed at review |
This is the Honest Baseline gate in practice. An improvement measured only on adjudicated data has no baseline the business can defend, and sits no higher than anecdote on the proof ladder until claims corroborate it.
What the evidence cannot establish
The 70% figure comes from a single engagement and should not be read as an industry rate. No independent study has yet measured how accurately fleets dismiss events across platforms, and that gap is itself telling.
The claim that operational data is usually the weaker record rests on public workplace injury and road casualty statistics, applied by analogy. It has not been tested directly on fleet telematics. The argument would be weakened if fleets that independently audit their dismissals showed no closer alignment between event rates and claims than fleets that do not.
The question to ask first
Technology has made risk visible at a scale no safety team could reach by observation alone. It has also created a new place for risk to hide: the review queue. The dismiss button is a risk control, and it deserves the same governance as any other.
Insurers, brokers and boards assessing a telematics programme should ask for the dismissal rate before they look at the safety score. A programme that can answer quickly, by reviewer and by site, is likely to be producing evidence worth pricing.
Is your programme's evidence ready for an underwriter?
The Connected Insurance Hub tests telematics and safety programmes against the same evidence standard insurers apply, from review governance to claims reconciliation.
- Trucking Info, VTTI study on in-cab coaching effectiveness
- ISPE, Human-in-the-loop as an illusion of control?
- Health and Safety Executive, Non-fatal injuries at work in Great Britain
- Health and Safety Executive, Preferred data sources
- Department for Transport, Road casualty statistics notes
- Department for Transport, Linking police and health data on road collisions: feasibility study
- arXiv 2509.02614, Use ADAS data to predict near-miss events