
What this means
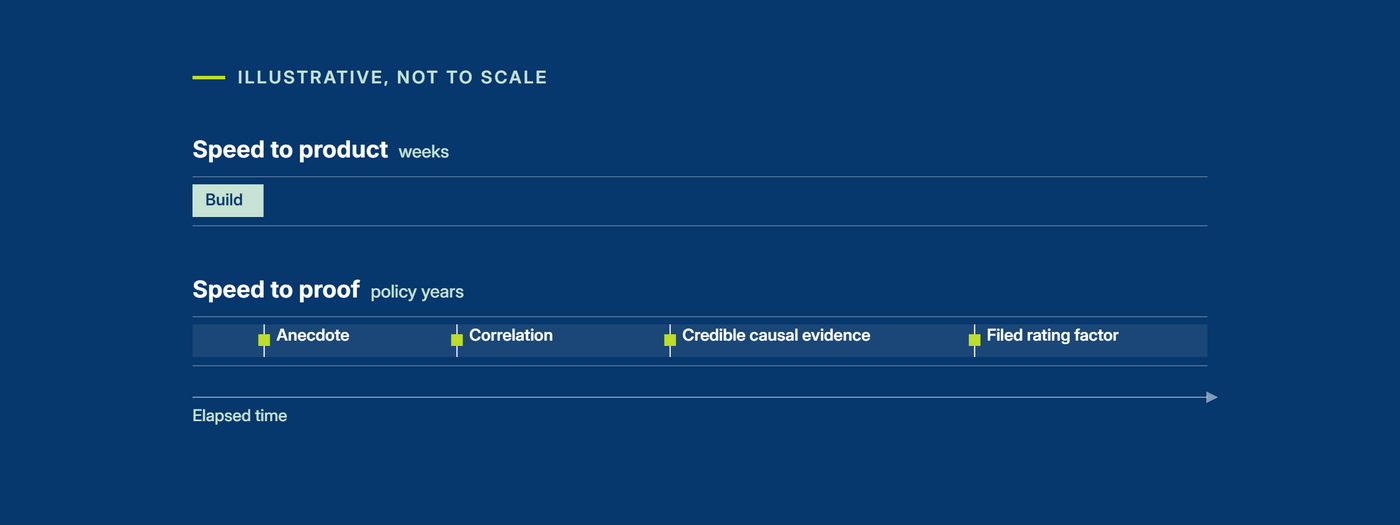
- AI has made risk technology quick to build. It has not shortened the time needed to show that a product changes losses.
- Three kinds of proof are often treated as one: behaviour changed, losses fell, and an insurer will price it. Only the last moves premium, and it takes longest.
- Value sits with whoever can generate attributable evidence and carry it into insurer terms. Vendors should budget for proof as seriously as for distribution.
The argument the market is now making
A view has hardened across software markets during 2026. When artificial intelligence can produce a credible product in weeks, the product stops being the moat, and advantage moves to whoever owns the route to the customer. Founders who once started with the product are now told to start with distribution.
For horizontal software, the argument is largely right. For technology sold into insurance as a loss control tool, it is incomplete, and the missing part is where most of the money sits. A risk technology product creates value only when it changes a loss outcome and that change can be evidenced to whoever is pricing the risk. Neither step has become faster because code has become cheaper.
The product got faster. The proof ladder did not.
Building a working risk technology product now takes a fraction of the time it once did. A telematics analytics layer or a computer vision model trained on site footage can reach demonstration quality quickly. That is a genuine gain, and it lowers the cost of testing ideas.
A demonstration, however, is the bottom rung. The proof ladder that underwriters apply runs from anecdote to correlation, then to credible causal evidence, and finally to a filed rating factor. Every rung above the first is governed by time constants that software speed does not touch.
| Stage | What AI accelerates | What it does not |
|---|---|---|
| Product build | Interface, analytics, model training and integration | Hardware certification, installation and field reliability |
| Data capture | Cleaning, labelling and feature extraction | Accumulating enough exposure to observe rare, severe losses |
| Behaviour change | Personalised coaching and alert targeting | Whether drivers or site teams keep changing behaviour after the first six months |
| Loss evidence | Faster claims analysis and matching | Claims development, especially long-tail bodily injury |
| Pricing | Speed of modelling once the data exists | An insurer's willingness to file a factor on a short or vendor-held dataset |
“Proof” covers three different claims, and they arrive at different speeds. Evidence that behaviour or exposure changed, such as fewer harsh-braking events or faster leak response, can appear within months. Evidence that losses fell needs enough claims to separate a real effect from a quiet year. Evidence an insurer will accept in pricing, whether a rating factor, a scheme rate or a credit on renewal terms, needs both, plus confidence that the effect will persist. This analysis is concerned mainly with the last two, because they are where premium and value move.
The Five Gates evidence standard reaches the same conclusion from another direction. Attribution, the master gate, asks whether an observed improvement can be credited to the intervention, as opposed to a change in business mix, a benign claims year or a shift in reporting behaviour. An honest baseline requires history from before deployment. Persistence requires elapsed time. None of these compresses because the product was built faster.
How long the loss evidence takes depends on claim frequency and tail. In high-frequency, short-tail lines such as motor own damage, a large fleet can show a credible loss signal within a policy year. In lower-frequency or long-tail exposures, bodily injury above all, the realistic expectation is two or three policy years before a loss ratio claim can carry weight in a pricing decision. A vendor that ships in eight weeks shortens neither clock.
Key insight
Speed to product has improved dramatically. Speed to proof has barely moved. The gap between the two is wider than it has ever been, and that gap is where both the risk and the value now sit.
Where value is created, and who captures it
If proof is the scarce asset, value accrues to whoever generates it or can convert it into price. Each position in the insurance value chain controls a different part of that sequence.
| Participant | Value created | What erodes | What stays durable |
|---|---|---|---|
| Software-only vendor | Workflow efficiency and visibility | Feature lead and pricing power as clones arrive | Outcome data tied to claims; depth of operational integration |
| Hardware-led vendor | Physical sensing and an installed base | The dashboard layer above the sensor | Field data history, installation footprint and certification |
| Insurer | Better selection and lower loss costs | Little, provided it can attribute outcomes | Claims data and the authority to file a rating factor |
| Intermediary | Matching technology to risk and placing the result | Introduction alone, as vendor discovery gets easier | Control of placement and the ability to turn evidence into terms |
| Risk owner | Fewer losses and a lower total cost of risk | Nothing, if the intervention persists | Its own operational and claims history |
Three qualifications sit behind the table.
The insurer's advantage depends on volume. An insurer with enough exposure in a line holds the most durable asset: claims data combined with the right to price. A smaller carrier or managing general agent without that volume relies on pooled or vendor data, and its position is weaker. In either case the binding constraint is a willingness to state in advance what evidence would count.
Intermediaries that control placement capture value twice. Referral arrangements on large enterprise deployments transfer part of a vendor's customer acquisition cost, and on multi-year contracts that is a material revenue line. A vendor's relationship with one insurer does not displace an intermediary that decides where the risk is placed. The more durable capture, though, comes from attested, derived evidence that converts into placement terms. Custody of raw data adds exposure without adding that value.
Risk owners gain most and are served least. When interventions work, most of the economic value lands with the operator who bears the loss, yet evidence tends to be packaged for insurers and seldom for the risk owner.
Distribution first, with a condition
The distribution thesis holds in risk technology with one condition attached. Distribution without proof scales the adoption of products that may never move the loss. Proof without distribution produces case studies that never reach a pricing decision. The participants that capture value hold both: a route to the risk owner and a mechanism that carries evidence through to insurer terms.
- Technology vendors should budget for the proof ladder as seriously as for go-to-market, with an honest baseline and a comparison group designed into every pilot from the first day. Software-only vendors need to climb it before a cheaper equivalent arrives; hardware-led vendors should treat the installed base and its data history as the asset, and the analytics layer as replaceable.
- Insurers should state what evidence would justify a rating factor and over what period. Vague appetite slows the whole market.
- Intermediaries should treat derived evidence and the placement it unlocks as the product, and use referral economics to fund the work of producing it.
- Risk owners should insist that vendor return-on-investment cases are tied to their own claims, and retain rights to the data each deployment produces.
What capital is signalling
Investment data from 2026 is consistent with the distribution thesis. It also adds qualifications that matter for insurance.
| Signal | 2026 evidence | Reading |
|---|---|---|
| AI is the default label | AI-focused firms took 95.2% of Q1 2026 insurtech funding and 99.1% of Q2 (Gallagher Re) | The label no longer differentiates; investors are selecting on something else |
| Capital follows traction | Five deals made up 76.2% of Q2 2026 capital in one tracked sample; later-stage firms took 89.8% (New Market Pitch) | Money is backing demonstrated commercial results ahead of new products |
| Distribution models draw steady deal flow | Digital broker and marketplace financings rose from two in Q4 2025 to nine in Q3 2026 in the same sample | Investors are funding ownership of the customer relationship, mainly in SME and personal lines |
| Hardware is regaining favour | Physical AI, including sensors and industrial automation, raised $47.4bn in H1 2026 (Crunchbase). The share of VCs putting at least 10% of deals into US hardware has doubled since 2022 (SVB) | Investors increasingly treat physical IP as harder for AI to replicate |
Two cautions apply. Headline totals are dominated by a handful of very large rounds: a single autonomous vehicle financing accounted for roughly a third of the physical AI figure. The insurtech datasets also diverge sharply on Q2 2026, with Gallagher Re recording $2.44bn and New Market Pitch $1.37bn, because they track different universes of companies. The direction of travel is consistent across sources. The magnitude is not settled.
What this analysis cannot establish
- Funding data measure investor belief, not customer outcomes. No 2026 dataset reviewed here shows AI-native risk technology producing loss ratio evidence faster than its predecessors.
- The insurtech samples are weighted heavily to North America, and European deal activity in the most recent quarter is thin.
- The AI-focused classification is broad. Near-universal use of the label limits what share figures can reveal.
The position would be wrong if insurers began filing rating factors on less than a full policy year of a single vendor's data, or if loss models trained on pooled industry data were accepted in place of insured-specific history. CIH has not seen evidence of either at scale.
Verdict
Cheap software has made risk technology abundant. It has not made proof abundant. The economics of loss control still turn on the question they always have: can a change in the loss be attributed, sustained and priced? Value will be captured by those who can answer it.
Your next step
“Where does my evidence stand?”
Evidence Credibility Calculator
Place a prevention claim on the proof ladder and see which of the Five Gates it clears. Free; a member account saves your progress.
Use the calculator“What evidence should I build next?”
Evidence and pilot design review
Your evidence placed on the proof ladder and tested against the Five Gates, with a written assessment and the pilot design that closes the gap. £2,950, excluding VAT.
Discuss the review All reviewsRead next on evidence and pricing
Sources
- Insurance Business: Gallagher Re Q1 2026 Global InsurTech Report
- Beinsure: Gallagher Re Q2 2026 Global InsurTech Report
- New Market Pitch: InsurTech funding, quarter by quarter (October 2026)
- Crunchbase News: Physical AI funding, H1 2026
- AI Weekly: Physical AI H1 2026 deal concentration
- SVB: Physical AI and the Future of Robotics 2026